Portrait des activités commerciales
Méthodologie
Méthode suivie pour la cartographie des cartes sur les activités commerciales
Les cartes illustrées ont été générées à l’aide du logiciel ArcGIS Online (ESRI), avec les données de pêche commerciale des trois communautés autochtones disponibles, obtenues du ministère Pêches et Océans Canada (MPO), pour la période entre 2010 à 2017. Les données de 2018, mis à part celles provenant du Nignag, n’ont donc pu être intégrées à l’analyse puisqu’elles n’étaient pas disponibles lors de la production de cet Atlas. Les cartes incluses dans ce portrait des pêcheries commerciales ont été validées par les directeurs de pêches respectifs pour ces trois communautés.
Pour certaines espèces dont la pêche s’effectue sur de petites étendues, tel le buccin commun, le crabe commun, le thon rouge, le maquereau et l’oursin vert, les cartes réalisées illustrent la localisation des petits secteurs pêchés. Ceux-ci ont été tracés à partir de la répartition des coordonnées de début et de fin des événements de pêche.
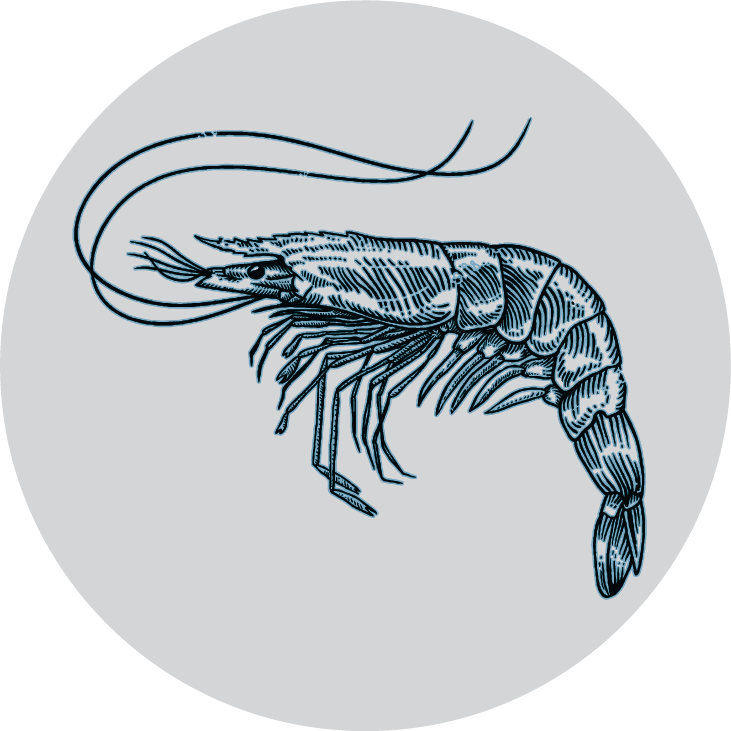
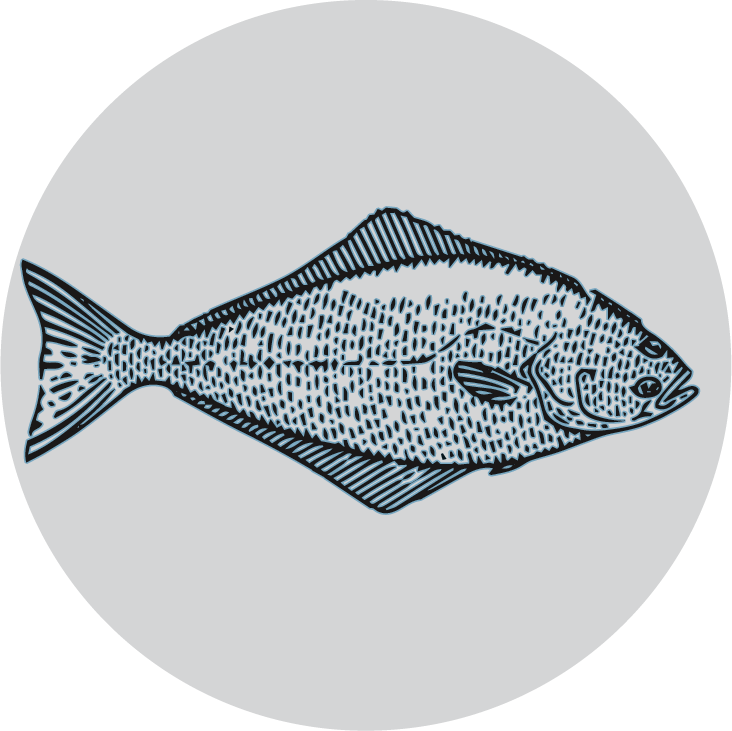
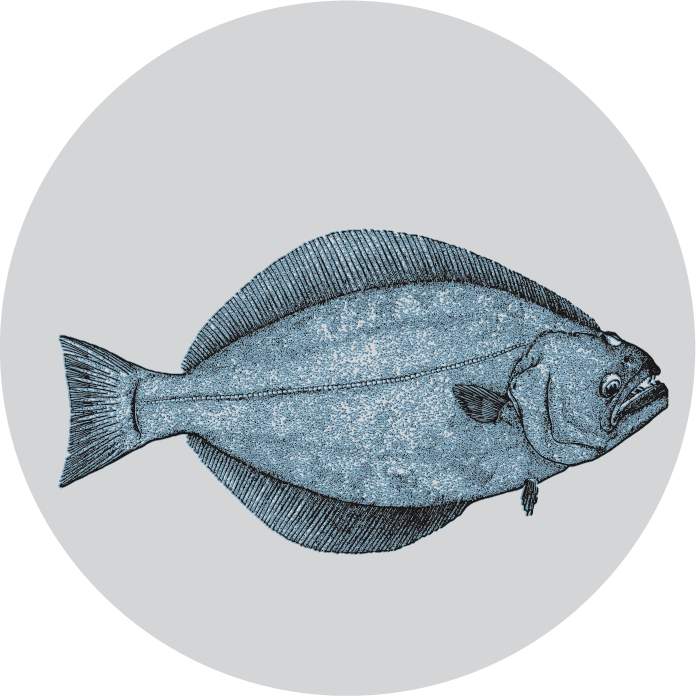
Pour ce qui est de la pêche à la crevette nordique, au crabe des neiges, au flétan du Groenland et au flétan de l’Atlantique, qui s’effectue sur de plus vastes étendues dans le fleuve, l’estuaire, le golfe St-Laurent et dans la Baie des Chaleurs, les cartes réalisées illustrent plutôt la quantité pêchée en kilogramme (kg) rapportée à l’unité du quadrilatère de pêche. Cette unité géographique utilisée par le MPO, qui présente une dimension approximative de 18 m x 25 km, couvrait bien l’ensemble des coordonnées de début et de fin des événements de pêche. Elle est en quelque sorte un dénominateur commun entre différentes espèces qui permet de comparer la localisation des pêches et les quantités capturées pour les trois communautés.
Finalement, les quantités de homard pêchées (kg) ont été estimées à partir des quantités vendues aux usines de transformation obtenues par le MPO, puisque la majorité des coordonnées et les quantités pêchées contenues dans les journaux de bord étaient manquantes ou erronées. Les cartes représentent la localisation de cette pêche qui a été estimée avec les zones de pêche au homard et la bathymétrie (< 20m).
Il est à noter que la valeur totale des captures a été estimée à partir du prix moyen annuel offert par espèce, également obtenu du MPO.
Le chapitre consacré à la culture d’algue localise, d’une part, les sites aquacoles contenant des filières louées de 2015 à 2018 par l’AGHAMW pour la production de macroalgues, et d’autre part, le nouveau site aquacole acquis par l’AGHAMW depuis l’automne 2018. Les polygones représentant les sites aquacoles ont été tracés à partir des coordonnées géographiques obtenues du MAPAQ. Les cartes illustrées dans ce chapitre ont été générées à l’aide du logiciel ArcGIS 10.6 (ESRI).
